Table of Contents
1.Understanding the NSE Option Chain Layout
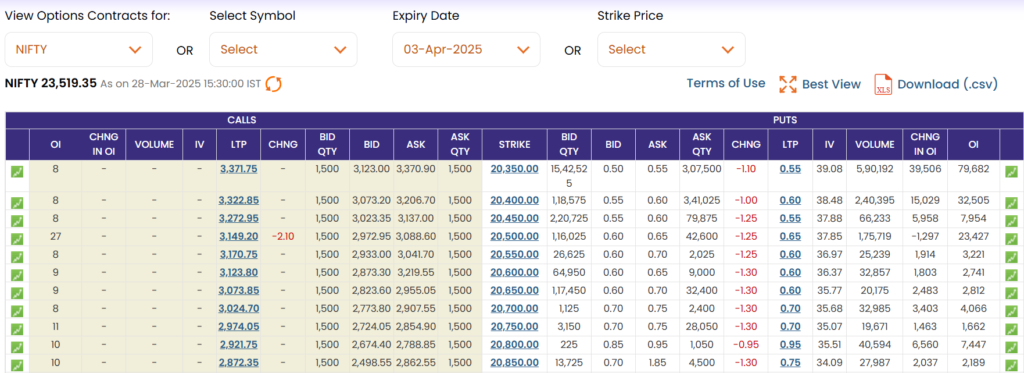
The NSE option chain provides a structured view of call and put options for indices like Nifty 50 and Bank Nifty. Key components include:
- Call Options (Left Side): Lists strike prices, bid/ask prices, last traded price (LTP), implied volatility (IV), volume, and open interest (OI) for bullish bets.
- Put Options (Right Side): Similar data for bearish bets, with strike prices and metrics like OI changes.
- Strike Price (Center): The price at which the option can be exercised. For example, if Nifty is trading at 23500, strikes like23600 (call) or 23400 (put) are available.
- Implied Volatility (IV): Reflects market expectations of price volatility. A higher IV indicates greater uncertainty.
Liquidity Focus: While NSE offers options on indices like Nifty IT, Nifty 50 and Bank Nifty dominate trading volume, making them practical choices for traders.
2. Weekly Expiry Dynamics
- Weekly Expiries: Nifty options expire every Thursday, with additional monthly expiries (last Thursday of the month). For instance, expiries on December 3rd, 10th, 17th, etc., allow short-term strategies.
- Monthly vs. Weekly: Monthly contracts (e.g., December 31st) are popular for longer-term bets, while weekly expiries cater to intraday or swing traders.
Note: Long-dated expiries (e.g., 5-year contracts) exist but lack liquidity, so focus on near-term contracts.
3. Buying Call/Put Options: A Practical Example
Call Option (Bullish Bet)
- Scenario: Nifty at 13,000. Buy a 13,200 call at ₹170/share.
- Lot Size: 75 shares (standard for Nifty), requiring ₹12,750 (75 × ₹170) 914.
- Break-Even: Strike price + premium = 13,200 + 170 = 13,370. Profit starts only if Nifty closes above this level at expiry 6.
- Payoff:
- Maximum Loss: ₹12,750 (premium paid) if Nifty stays below 13,200.
- Unlimited Profit: If Nifty surges to 14,000, profit = (14,000 – 13,200) × 75 = ₹60,000.
Put Option (Bearish Bet)
- Scenario: Buy a 12,800 put at ₹186/share.
- Break-Even: Strike price – premium = 12,800 – 186 = 12,614.
- Profit Zone: Nifty must drop below 12,614 to profit. Below 12,800, losses reduce gradually.
4. Key Metrics in Option Trading
- Open Interest (OI): Total outstanding contracts. Rising OI indicates new positions, while falling OI suggests closures.
- Volume: Number of contracts traded daily. High volume signals liquidity and trader interest.
- Probability of Profit: Tools like Opstra (a strategy builder) estimate profit likelihood. For example, a 29% probability means high risk-reward asymmetry.
5. Risk-Reward and Strategy Tools
- Payoff Charts: Visualize profit/loss zones. For a 13,200 call:
- Losses taper as Nifty approaches 13,200.
- Profits escalate beyond 13,370 68.
- Strategy Builders: Platforms like Sensibull allow testing scenarios. For instance:
- Input strike, expiry, and lot size to analyze break-even, max loss, and profit potential.

For real-time data, visit NSE India or platforms like NiftyTrader.
6.Understanding ITM, ATM, and OTM Call Options: A Strategic Guide for Traders
Navigating call options requires clarity on strike price selection. Here’s a breakdown of In-the-Money (ITM), At-the-Money (ATM), and Out-of-the-Money (OTM) call options, using Nifty as a practical example.
7. Definitions: ITM, ATM, OTM
- In-the-Money (ITM) Call Option:
- Strike Price < Market Price (e.g., Nifty at 13,000; 12,500 strike).
- Already has intrinsic value (immediate profit if exercised).
- Example: 12,500 call costs ₹600/share (₹45,000 for 75 shares/ 1 lot).
- At-the-Money (ATM) Call Option:
- Strike Price ≈ Market Price (e.g., 13,000 strike).
- Balances cost and probability.
- Example: 13,000 call costs ₹300/share (₹22,500 for 75 shares).
- Out-of-the-Money (OTM) Call Option:
- Strike Price > Market Price (e.g., 13,500 strike).
- No intrinsic value; purely speculative.
- Example: 13,500 call costs ₹75/share (₹5,625 for 75 shares).
8. Risk-Reward Analysis
| Metric | ITM (12,500) | ATM (13,000) | OTM (13,500) |
|---|---|---|---|
| Premium Paid | ₹45,000 | ₹22,500 | ₹5,625 |
| Break-Even | 13,100 | 13,300 | 13,575 |
| Probability | High (~60-70%) | Moderate (~40%) | Low (~10-20%) |
| Max Loss | ₹45,000 | ₹22,500 | ₹5,625 |
| Profit Potential | High (e.g., 13,400 → ₹900/share profit) | Moderate (e.g., 13,400 → ₹100/share profit) | Low (needs >13,575 to profit) |
Key Observations:
- ITM: High upfront cost but higher probability of profit due to intrinsic value.
- OTM: Low cost but requires a large price surge (e.g., Nifty rising 575+ points) to break even.
- ATM: Middle ground for traders balancing risk and reward.
9. Practical Scenarios
If Nifty Closes at 13,400:
- ITM (12,500 call): Profit = (13,400 – 12,500) – ₹600 = ₹300/share (₹22,500 total).
- ATM (13,000 call): Profit = (13,400 – 13,000) – ₹300 = ₹100/share (₹7,500 total).
- OTM (13,500 call): Loss = ₹75/share (expires worthless).
If Nifty Closes at 13,000:
- ITM: Loss = ₹600 – (13,000 – 12,500) = ₹100/share (₹7,500 total).
- ATM: Full loss of ₹22,500.
- OTM: Full loss of ₹5,625.
10. Why Traders Choose OTM Despite Low Odds
- Low Capital Requirement: Ideal for small accounts (e.g., ₹5,625 vs. ₹45,000 for ITM).
- Leverage: Amplified returns if the market surges (e.g., Nifty hitting 14,000 yields 500+ points profit).
- Psychological Appeal: “Lottery ticket” mindset hoping for a breakout.
11. Preference: ITM Options
- Higher Probability: ITM’s intrinsic value acts as a cushion.
- Lower Risk Than Futures: Avoids MTM (mark-to-market) volatility and lower stamp duty.
- Practical Use Case: Replaces futures for directional bets with defined risk.
Key Takeaways
- Focus on Liquid Indices: Prioritize Nifty and Bank Nifty due to higher liquidity.
- Expiry Selection: Weekly for short-term, monthly for longer horizons.
- Break-Even Matters: Account for premiums. A call’s break-even = strike + premium.
- Risk Management: Limit losses to the premium paid (₹12,750 in the example).
- Leverage Tools: Use option chains and strategy builders for data-driven decisions.
- ITM: Best for conservative traders prioritizing probability over cost.
- OTM: Suitable for speculative bets with limited capital.
- ATM: Balances cost and market neutrality.
- Break-Even Matters: Always account for premiums (e.g., OTM needs a 5%+ rally to profit).
Pro Tip: Use platforms like NSE India or Opstra to analyze options chains and payoff charts.
Thank you for reading! Master these concepts to align your strategy with market expectations.
